


Waves, Logistic Mapping, and Volatility
This is the 2nd installment of a series focused on volatility from different angles. If you missed the first one, check it out here.
Introduction
Since 2018, the markets have been experiencing an interesting pattern that bears some resemblance to a cyclical pattern. In what we would describe as a megaphone pattern from a technical trading perspective, we can see that the highs continue to get higher and the lows continue to get lower.
In my last article, we explored how “herd” investing creates an interesting phenomenon called stochastic resonance which can cause extreme swings and volatility to occur despite safe investing practices (diversification, low-risk methods, etc.). In this article, we’re going to explore an interesting thought exploration that was kicked off by the president of Real Vision, Travis Kimmel, who is an emerging macroeconomic trader. Let’s dive in!
Linear Thinking in the Markets
One of the aspects of the market that worries me the most is the passive ETF investing that is happening. With an emerging trend of FIRE (Financially Independent, Retire Early), an absolute torrent of individuals is investing in the same ETFs, creating massive concentration into a small number of stocks. We hear meme phrases like "Buy the fucking dip” and “Stonks only go up” which, to their credit, has worked out well from purely an equities perspective. This largely seemed to kick off in 2018 when companies like Betterment, Wealthfront, Robinhood, and Acorns started to really take off. It’s no secret that these companies largely invest in low expense ratio ETFs, which are predominately provided by Vanguard.
This creates consensus-driven linear thinking that minimizes active price discovery. If everyone is just banking on their dollar cost average in the market going up then most don’t care about what price they get their shares at. This lack of seeking price discovery ends creates a dramatic equities mispricing relative to normal value investors would consider are “safe” investments. To put this into numbers, a healthy PE ratio for value investing is between 15 and 25. The average PE ratio in the S&P500 as of this writing was 40. It is clear that there are a ton of zombie corporations that don’t produce growth or profits are getting dramatically mispriced due to the indexification of everything.
Now, up to this point, this has been largely a recap of what I’ve written in the past. What we’re going to look at today is something called a logistic map and how it is a great way to think about volatility that we have recent and likely future experience in.
Logistic Mapping
Logistic Mapping is a polynomial mapping - also known as a quadratic function. This function is often used as a means for describing how small events can generate chaotic behaviors that alter outcomes.
If you want a deeper dive into the variables and mathematics of logistic maps, check out the Wikipedia page.
The best way to think of this is going back in your life and reflecting on what felt like small events at the moment (eg. meeting someone, taking a new job, etc.) and how much they have dramatically influenced the outcome of your life. That is a form of logistic mapping in a sense. If you were to simulate your life out over and over again, you would get something that looks like this:

Another way to hammer home the point is the animation below. This shows the amplitude and frequency content of some logistic map through multiple iterations when the input parameters start at 2 and go to 4. Watch below and you can see just how quickly things escalate.

To sum things up: Small things can have big impacts.
The Markets
Let’s go back to the markets real quick so the rest of this article makes sense. Historically, traders and investors used options as a way of protecting tail-end risk. Meaning, I would have exposure to the market through owning common stock and provide myself with a hedge through leveraging options to hedge against market volatility. A quick reminder that options do not move 1:1 with the overarching asset since they are a derivative of the asset. This generates a non-linearity of price between the underlying derivatives and the asset. In mathematical finance terms, we call this convexity. In short, when you visualize this, instead of getting a linear function you get a curve function - or a wave.
And then there are these charts:
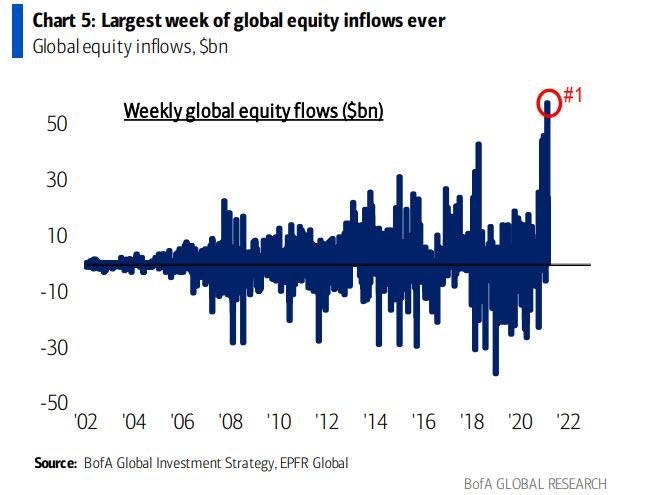

We see an ever-increasing inflow of capital into the equities market and at the same time, we see a massive increase in total call option volume since ~2018 (curious that those dates line up on the chart!).
So what’s happening here? A couple of things. First, we see that the growth of the S&P500 continues to go up but with much more dramatic and volatile swings. This is likely due to more capital being used for the options market. Second, we see that options are no longer being used as a risk management technique but instead as a speculative vehicle for dramatic gain/loss exposure.
So, the next obvious question is “Well, AO, why should I be worried about this? How much risk could actually be out there that would cause you to write a multi-series article on this?”. Here, young padawan, take a look at this chart. Squint hard enough and you might be able to see the size of the stock market.
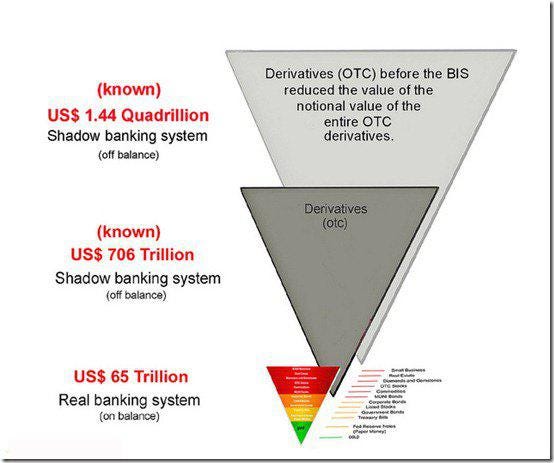
So, yeah, it’s fucking massive.
The Risk
Now that we’ve covered just how big these markets are and how much they are growing, let’s dive into the risk.
If we go back to the concept of convexity as a curve, a curve is effectively a wave. To quickly dive deeper, convexity is a second-derivative within the options market. This is referred to as Gamma which measures the change in Delta (first-order derivative) relative to changes in the underlying price. Gamma looks like this on a chart:
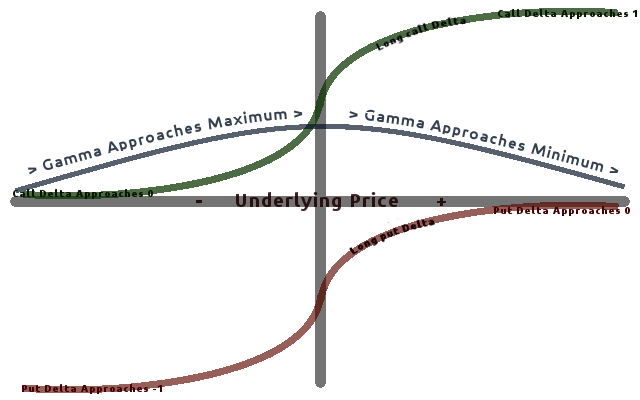
So, since convexity is effectively a form of a wave, we can generally assume that the market has largely moved from an aggregate linear function to an aggregate wave function. This concept of a wave function will be extremely important in a few so hang onto that thought for a moment.
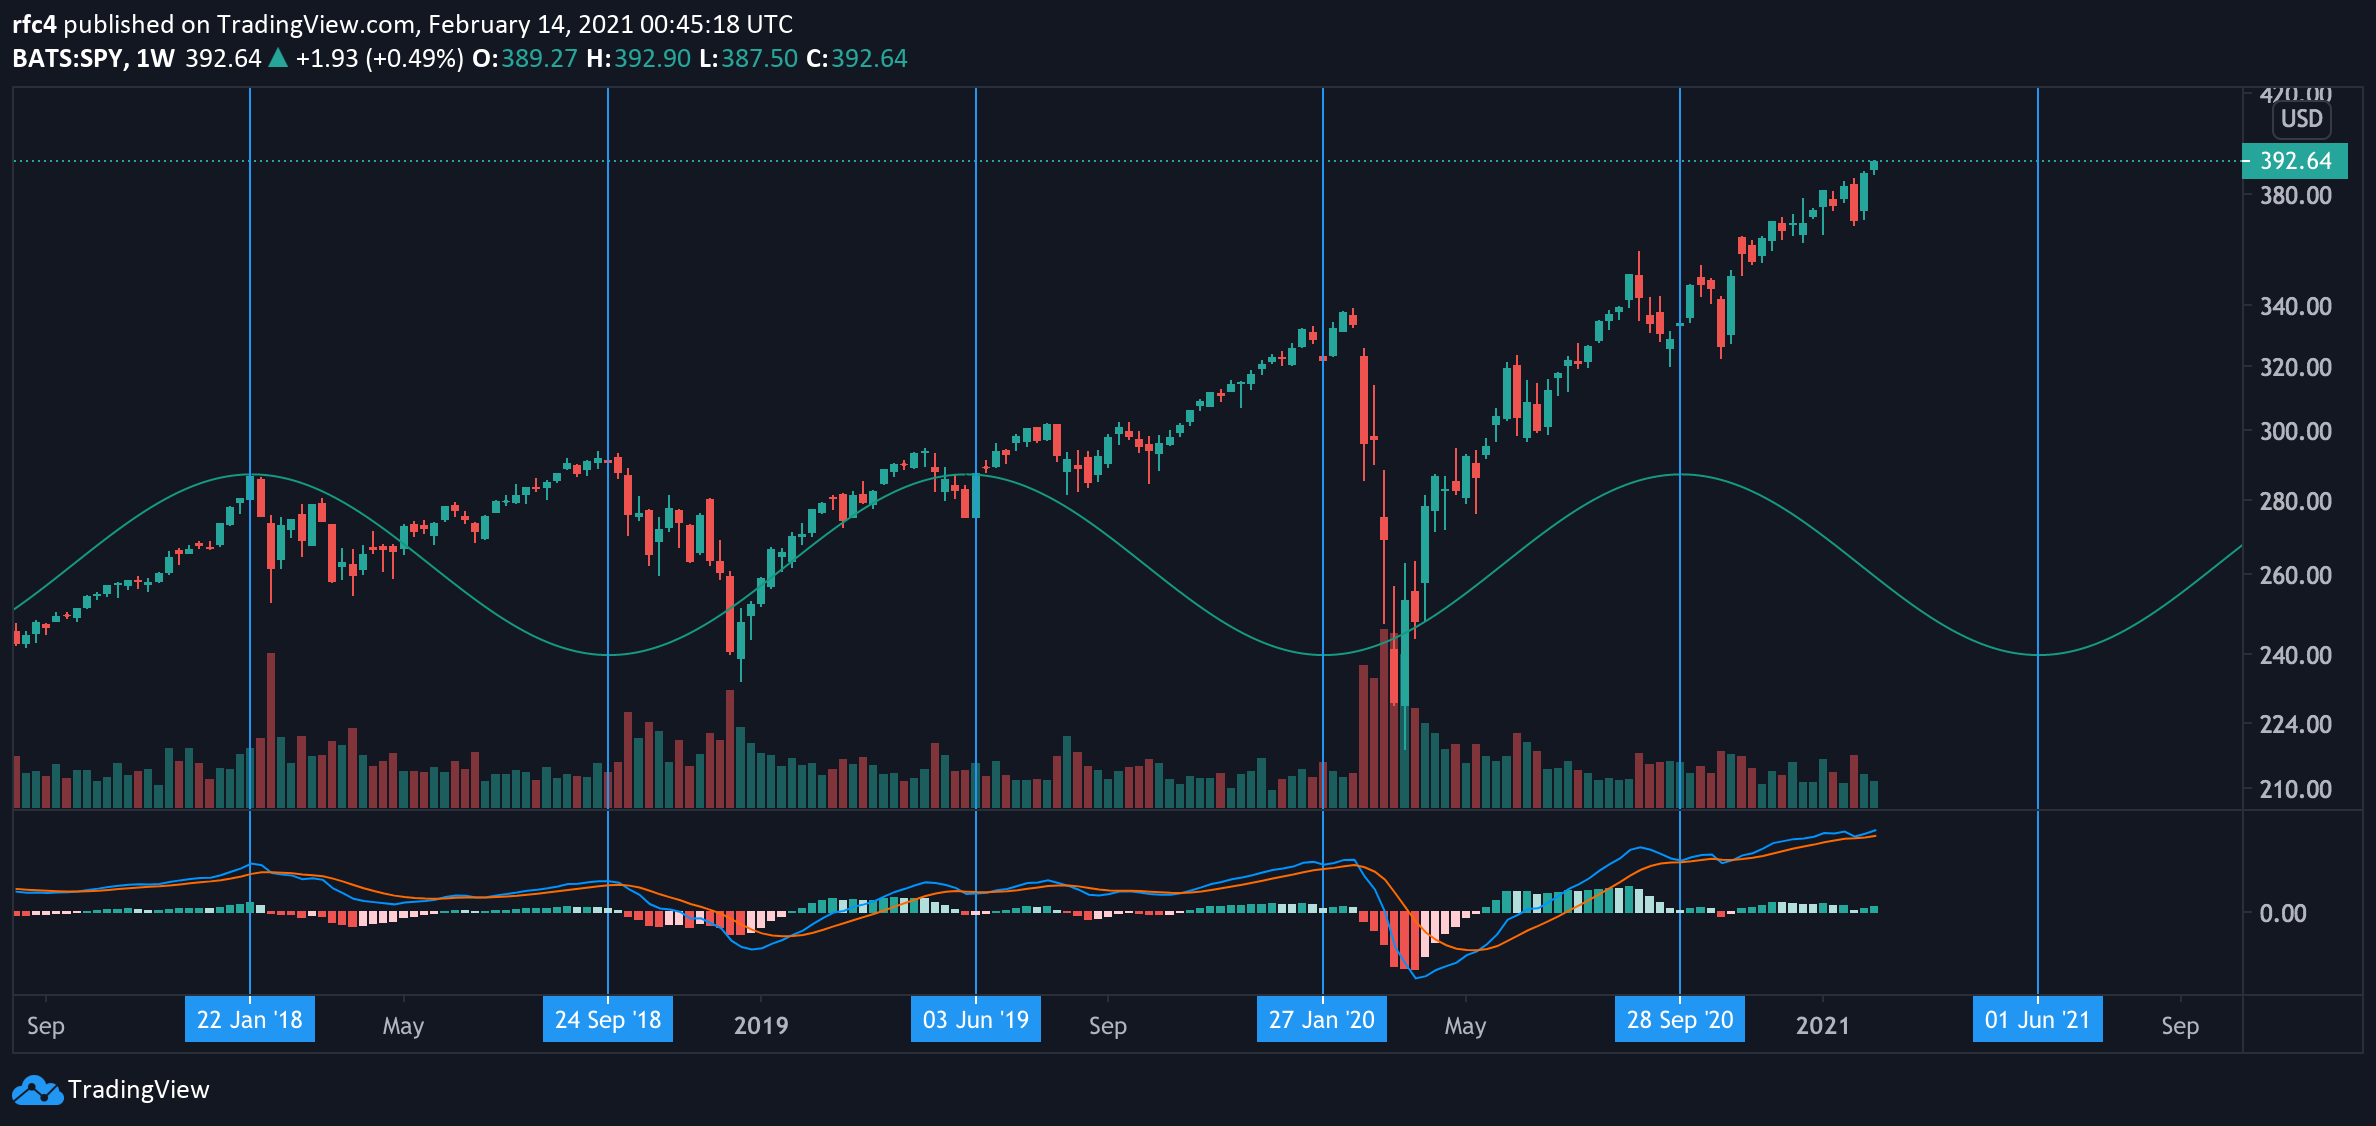
Since 2018, there have been some dramatic growths in the call options entering the market. What is interesting from a charting perspective is that the $SPY started a megaphone pattern in January of 2018 with its first battle with volatility.

More interestingly, we actually see the peak prices moving in a parabolic way as charted below.

If we overlay a Fibonacci time zone analysis on top of it as well, we get some really interesting alignments to market corrections:

If we do the same thing on the $VXX (volatility hedge), we see very similar results:

Traditional traders who trade common stock (linear trading) are muted or “not home” because they are passively investing their capital. The active traders have shifted their trading to relying heavily on options to increase their risk/reward payouts. Per my last article, this creates a coherence resonance within the market.
In a coherence resonant market, innocuous or weak events can get amplified dramatically.
That sounds a lot like the definition of logistic mapping, doesn’t it? Small events creating large ramifications. Let’s continue our little acid trip down the rabbit hole.
Since 2018, there has been more and more trading & investment bifurcation. We have the passive investors and the options traders. It’s clear that the options traders are in the driver’s seat at this point and are highly reactive to events that happen on a macroeconomic basis or within the markets themselves. If we go back to thinking about convexity as a wave, we are basically experiencing amplifying waves happening in the market. Want to see what that might look like?

Hmm… for shits and giggles, what happens when we layer over a sinewave onto the $SPY?
I may be grasping for straws on the last one but at each peak and trough (+/- a few weeks), there seems to be increased volatility. Curious, but nothing that drives the point home. I’m going to steal Travis Kimmel’s image as the last image on this line of thought:

A logistic map overlayed onto the $SPY. When coherence resonance hits its peak, we quickly move into stochastic resonance. A chaotic harmonic decline in the market. What triggers the shift? What can cause the market to move into a logistic mapping type of state where small events cause dramatic outcomes? Almost anything. Regulation, geopolitical tensions, civil unrest, supply chain disruption, government intervention, legislation, war, you name it. Mathematics can be absolutely beautiful sometimes.
What path in the logistic map is next for us? What event will shift us from a coherence market to a stochastic chaotic one?
Closing Thoughts
A quick story: I’m the type of guy that when someone tells me something has to be a certain way because it’s always been that way, my mind immediately races towards how I can get around the classical way of doing something.
When I was in junior high, I was blessed to watch a documentary called “What the Bleep Do We Know?”. This documentary covered all sorts of amazing topics with the core theme of attempting to drive a connection between the mysterious quantum physics world and human consciousness. I fell in love with quantum physics because I viewed it as a huge fuck you to traditional boring physics with its seemingly stupid constraints.
Within the documentary was a section on quantum superposition. Quantum superposition is the concept that singular objects (such as a photon) can exist in the same location at the same time, when not being observed. This was popularized by the double-slit experiment in which a single electron particle was shot through an unobserved slit. The logical outcome would be “1 photon, 1 beam of light on the wall behind it”. Instead, the wall showed a wave, proving that unobserved objects are, in fact, just waves that collapse once observed.

This concept absolutely blew my mind and challenged me on every level to try to understand what “reality or real” actually was. Are solid objects not singular? If I’m not observing something, does it resort to a waveform?
How does this random story map to all the shit you just read? Well, in the double-slit experiment, when the electrons were being blasted through the slit unobserved (no impact from an outside event), they reacted as a waveform. The moment a human observed the experiment (impact from an outside event), the electrons collapsed from a waveform back into a single electron. This is called wave function collapse.
The questions below led me to write this article:
If the markets are operating on huge volumes of unhedged options, in which these options are operating on large convexity curves, what happens when a small outside event impacts the options?
Do we experience a type of wave function collapse? (convexity curve collapse)
Does that kick off a new path within the logistic map?
Does that move the markets temporarily from coherence to a stochastic state?
Here’s my YOLO/closing statement of the article:
It is my belief that in the near future, we will experience a defining event that effectively creates a wave function collapse in the convexity curves of the options/derivatives market, causing a massive shift from market coherence resonance to stochastic resonance - with resonance representing a systemic lack of liquidity required to cover overly exposed leveraged positions, creating explosive demand for cash and credit.
If you liked this article, please consider sharing this post with friends and family. They take a long time to create so any support is greatly appreciated!
- AO